Car Data Analysis
Analysis of the Three Charts
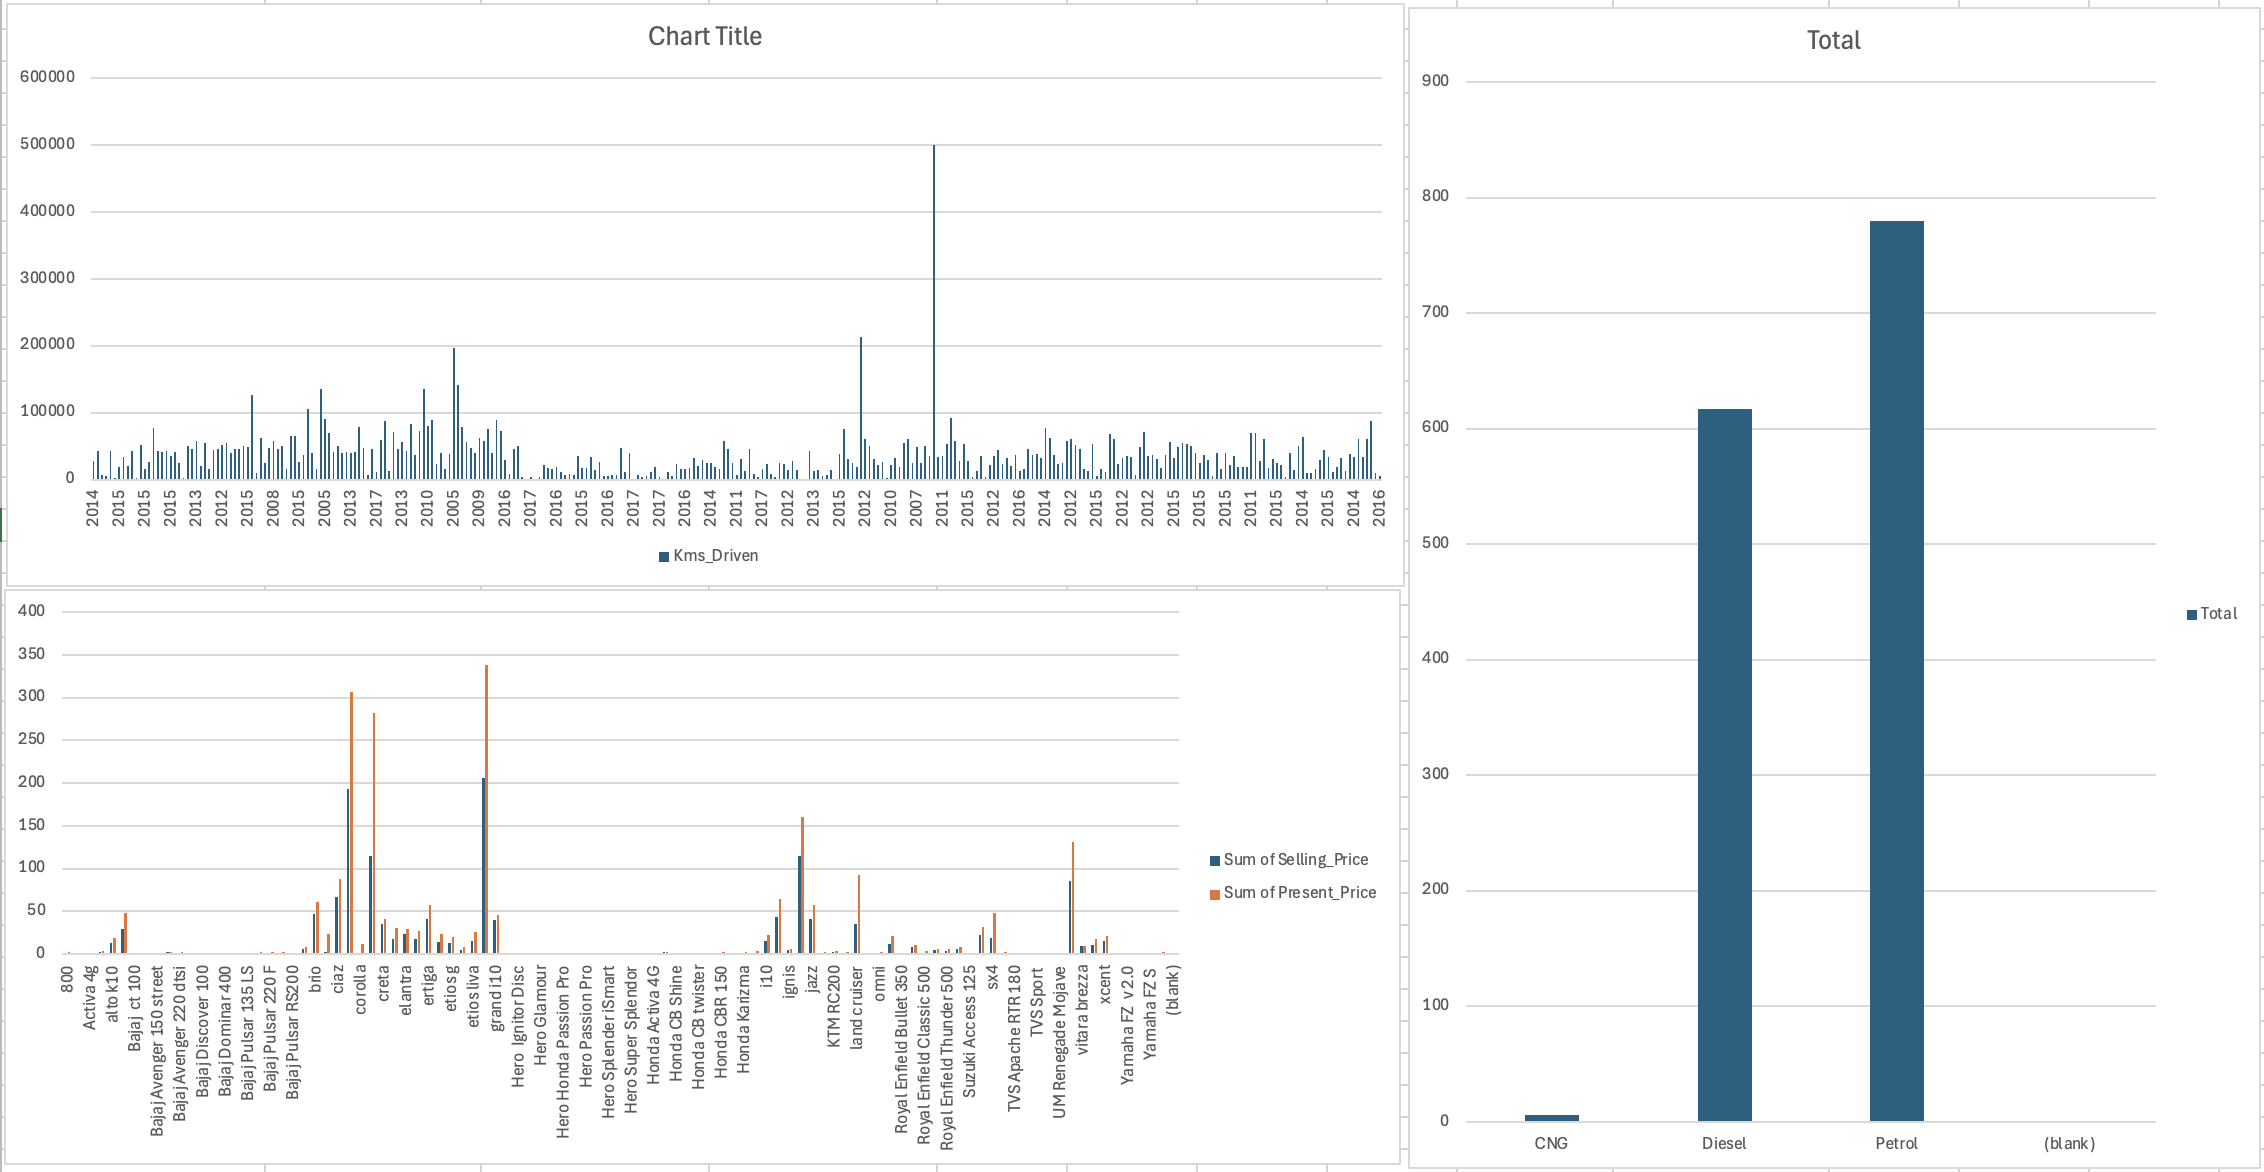
1. Top Left Chart: Yearly Sum of Kilometers Driven
- This chart provides insight into the cumulative distance driven across all vehicles for each year.
- The trend is highly irregular, with notable peaks and troughs. Some years show significantly higher total mileage, possibly due to a large number of vehicles being included in the dataset for those years.
- There are a few years with extreme spikes in kilometers driven, suggesting that some vehicles in those years have exceptionally high mileage.
- The dataset might include a mix of newer and older cars, meaning some years could appear inflated due to older vehicles with accumulated miles being accounted for.
- If the peaks correspond to older vehicles, this could suggest that buyers in those years purchased used cars with higher mileage rather than new cars.
2. Bottom Left Chart: Selling Price vs. Present Price Across Car Models
- This chart provides a direct comparison between the sum of selling prices (blue) and sum of present prices (orange) for various car models.
- For almost all models, the sum of present prices is higher than the sum of selling prices, which makes sense because cars depreciate in value over time.
- Certain models show significant gaps between the present price and the selling price, indicating vehicles that retain their value better than others.
- Some models, particularly well-known ones, show higher selling prices, which might suggest higher demand in the second-hand market.
- If there are models where the selling price is close to the present price, it could indicate that these models are either newer (not much depreciation yet) or have strong resale value.
3. Right Chart: Comparison of Total Selling Price by Fuel Type
- This chart compares the total selling price of Diesel, Petrol, and CNG cars in the dataset.
- Petrol cars have the highest total selling price, followed by Diesel cars, with CNG cars having a negligible total selling price.
- This could indicate that petrol cars dominate the dataset, either due to higher availability or greater demand in the second-hand market.
- Diesel cars, despite having lower total selling prices than petrol, still hold significant value, suggesting they are also widely traded.
- The low total selling price of CNG vehicles could mean either that there are fewer CNG vehicles in the dataset or that CNG cars depreciate more quickly than their petrol/diesel counterparts.
Key Takeaways & Arguments
1. Depreciation Insights
- Most cars experience a significant drop in value from their present price to their selling price, highlighting depreciation as a key factor in second-hand car transactions.
- Certain car models retain their value better than others, making them better investments in the used car market.
2. Market Demand for Fuel Types
- Petrol cars seem to dominate the market in terms of selling price, potentially due to greater availability or preference among buyers.
- Diesel cars also hold considerable resale value, likely due to their fuel efficiency and durability.
- CNG cars have low representation, which may suggest a niche market or lower resale demand.
3. Mileage Trends & Used Car Market
- The top left chart shows that certain years have a much higher cumulative mileage. This could indicate that the second-hand market sees more transactions of older, high-mileage vehicles during those years.
- If high-mileage cars are frequently resold, it could indicate that buyers in the used car market are willing to compromise on mileage in exchange for lower prices.
4. Investment Decisions
- If choosing between different fuel types, petrol cars might be the safest investment due to their strong resale presence.
- Some specific models appear to retain their value better, making them good choices for resale.
Car Data Table (first 50 rows)
ritz
2014
3.35
5.59
27000
Petrol
Dealer
Manual
0
sx4
2013
4.75
9.54
43000
Diesel
Dealer
Manual
0
ciaz
2017
7.25
9.85
6900
Petrol
Dealer
Manual
0
wagon r
2011
2.85
4.15
5200
Petrol
Dealer
Manual
0
swift
2014
4.6
6.87
42450
Diesel
Dealer
Manual
0
vitara brezza
2018
9.25
9.83
2071
Diesel
Dealer
Manual
0
ciaz
2015
6.75
8.12
18796
Petrol
Dealer
Manual
0
s cross
2015
6.5
8.61
33429
Diesel
Dealer
Manual
0
ciaz
2016
8.75
8.89
20273
Diesel
Dealer
Manual
0
ciaz
2015
7.45
8.92
42367
Diesel
Dealer
Manual
0
alto 800
2017
2.85
3.6
2135
Petrol
Dealer
Manual
0
ciaz
2015
6.85
10.38
51000
Diesel
Dealer
Manual
0
ciaz
2015
7.5
9.94
15000
Petrol
Dealer
Automatic
0
ertiga
2015
6.1
7.71
26000
Petrol
Dealer
Manual
0
dzire
2009
2.25
7.21
77427
Petrol
Dealer
Manual
0
ertiga
2016
7.75
10.79
43000
Diesel
Dealer
Manual
0
ertiga
2015
7.25
10.79
41678
Diesel
Dealer
Manual
0
ertiga
2016
7.75
10.79
43000
Diesel
Dealer
Manual
0
wagon r
2015
3.25
5.09
35500
CNG
Dealer
Manual
0
sx4
2010
2.65
7.98
41442
Petrol
Dealer
Manual
0
alto k10
2016
2.85
3.95
25000
Petrol
Dealer
Manual
0
ignis
2017
4.9
5.71
2400
Petrol
Dealer
Manual
0
sx4
2011
4.4
8.01
50000
Petrol
Dealer
Automatic
0
alto k10
2014
2.5
3.46
45280
Petrol
Dealer
Manual
0
wagon r
2013
2.9
4.41
56879
Petrol
Dealer
Manual
0
swift
2011
3
4.99
20000
Petrol
Dealer
Manual
0
swift
2013
4.15
5.87
55138
Petrol
Dealer
Manual
0
swift
2017
6
6.49
16200
Petrol
Individual
Manual
0
alto k10
2010
1.95
3.95
44542
Petrol
Dealer
Manual
0
ciaz
2015
7.45
10.38
45000
Diesel
Dealer
Manual
0
ritz
2012
3.1
5.98
51439
Diesel
Dealer
Manual
0
ritz
2011
2.35
4.89
54200
Petrol
Dealer
Manual
0
swift
2014
4.95
7.49
39000
Diesel
Dealer
Manual
0
ertiga
2014
6
9.95
45000
Diesel
Dealer
Manual
0
dzire
2014
5.5
8.06
45000
Diesel
Dealer
Manual
0
sx4
2011
2.95
7.74
49998
CNG
Dealer
Manual
0
dzire
2015
4.65
7.2
48767
Petrol
Dealer
Manual
0
800
2003
0.35
2.28
127000
Petrol
Individual
Manual
0
alto k10
2016
3
3.76
10079
Petrol
Dealer
Manual
0
sx4
2003
2.25
7.98
62000
Petrol
Dealer
Manual
0
baleno
2016
5.85
7.87
24524
Petrol
Dealer
Automatic
0
alto k10
2014
2.55
3.98
46706
Petrol
Dealer
Manual
0
sx4
2008
1.95
7.15
58000
Petrol
Dealer
Manual
0